How much energy does one society consume ?
This question has been
entertaining us for a cuple of years now and the devastating numbers
that were determined brought us the simple answer: too much. At least
for our current energy system that still primarily depends on fossil
fuels, which slowly but certainly seem to come to an end.
It is of utmost importance to ascertain how much time we have left to fulfill the change to a new system that is based on renewable sources of energy, because those measures will proof the fact that we need to change our attitude towards fossil fuels on the one hand and energy consumption in terms of our western lifestyle on the other hand.
In order to get a precise impression about how much of our precious fossil fuels we actually consume, we compared and analyzed data published by the International Energy Agency (IEA), the U.S. Energy Information Administration (EIA) and BP's Statistical Review of World Energy.
Global Energy Consumption by resource in 2001
The numbers are given in million tonnes of oil equivalent. All numbers are based on the World Energy Outlook 2011 by the IEA, the Statistical Review of world energy 2012 by BP, and the Annual Energy Outlook 2012 by the EIA.
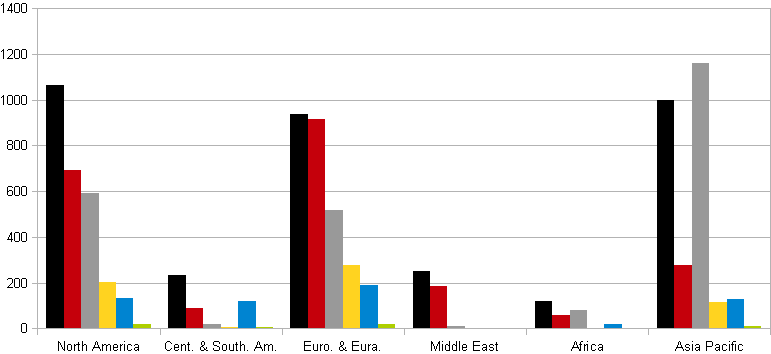

This bar chart shows the Global Energy Consumption by resource in 2001. Due to comparability we have calculated all the data in million tonnes of oil equivalent.
As we can see 12 years ago the three biggest suppliers were the untouchable oil, coal and natural gas. In addition to that it is the western industrialized countries who consume by far the biggest share, given the fact that North America consumes almost ten times more oil than Africa (acc. to BP Statistical Review of World Energy).
However due to various Hydroelectric Projects even the renewable sources of energy start to make up a considerable share in the energy consumption. Actually with 641,1 Million tonnes of oil equivalent there has been more renewable energy generated on this planet than there has been nuclear, with the hatred sources generating only 600,8 Million tonnes of oil equivalent.
But let's not get carried away because after all we still consume thirteen times more fossil energy than renewable energy.
Despite those foreshadowing numbers one should bear in mind that those numbers are twelve years old and there has been a lot of development going on since 2001. At least that's what the politicians want us to think.
Change in the Global Energy Consumption from 2001 to 2011
The numbers are given in million tonnes of oil equivalent. All numbers are based on the World Energy Outlook 2011 by the IEA, the Statistical Review of world energy 2012 by BP, and the Annual Energy Outlook 2012 by the EIA.
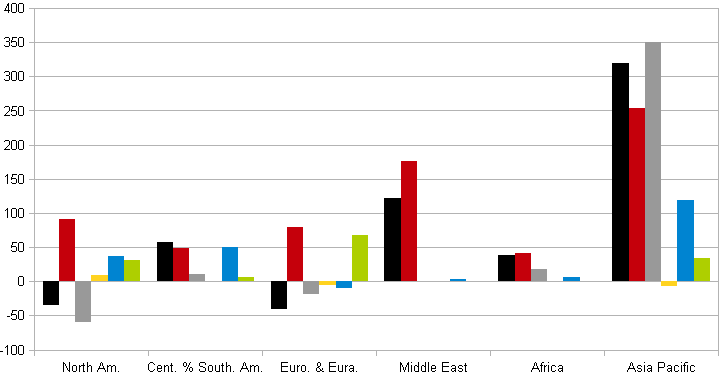
Now this next chart shows
us the difference - if there is much of a difference – between the
consumption in 2001 and the consumption in2011, however as one can
see after ten years still we still have not made a remarkable change.
Although we have some
increase in the consumption of renewable energy, we are still lacking
the decrease in the consumption of fossil energy, since we can not
just endlessly keep on generating more and more energy.
And the reason for that is the urgent need of finding a way of using energy sustainably, if we want to a) make a go with the amount of fossil fuels left for the period of time that is required to fulfill the change from our current system to a system that is primarily based on renewable sources of energy, and b) supply our whole planet with renewable energy and not just use those new sources as positive PR for the industrialized countries.
In contrast to that need of decrease, the growth in Asia Pacific's coal consumption is with 1339.2 million tonnes of oil equivalent even bigger than the total coal consumption of the rest of the world. It was in fact so big we needed to compress its bar otherwise it would have blown up the scale.
But what caused this enormous increase ?
Well Asia Pacific is the part of the world with the highest population density, China and India alone make up 30,4 per cent of the world's whole population according to the CIA World factbook. So the industrialized western countries need to compensate for the growing demand for energy in those less developed countries, in order to keep the total consumption figures relatively in balance.
In addition to the population issue another reason for Asia's growth in consumption is that western companies start to outsource there production specifically into these countries due to lower wages.
According to this phenomenon one would immediately assume that since the industry is leaving the western countries the energy consumption in the western world would automatically decrease.
However the inconvenient truth is that the consumption figures still keep rising.
Global Energy Consumption by resource 2011
The numbers are given in million tonnes of oil equivalent. All numbers are based on the World Energy Outlook 2011 by the IEA, the Statistical Review of world energy 2012 by BP, and the Annual Energy Outlook 2012 by the EIA.
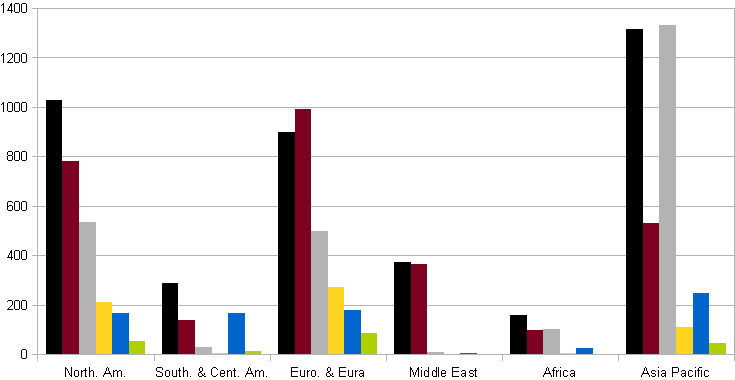
Which leads us to this: the last chart showing the global energy consumption by ressource in the year 2011 and at first sight if you compare it to the figures for 2001 you will hardly spot any difference apart from this one perhaps.
You see the trend towards renewable sources of energy is actually noticeable when you compare the numbers. While we consumed 641,1 million tonnes of oil equivalent of renewable energy in 2001 numbers have risen to 986 million tonnes of oil equivalent, which is a growth of more than 50 per cent.
According to this increase, the ratio between renewable sources of energy and fossil fuels is now 10,7 to 1 rather than 12,7 to 1 in the year 2001. And luckily it actually keeps getting better because nuclear energy has lost a bit of it's priority as well. As we can see if we compare the charts for 2001 and 2011 renewable sources have already been consumed more than nuclear energy in 2001 but in 2011 it is 986 million tonnes of oil equivalent for renewable energy against only 595,8 million tonnes of oil equivalent for nuclear energy.
Sadly though once again we must not get carried away because still fossil fuels make up about 10,5 billion tonnes of oil equivalent.
Summ it all up and you will know that over those ten years the global energy consumption has increased by 30%, which is an alarming number on it's own.
So far we have established that renewable sources do have the potential and that the demand for renewable energy grows faster than the energy demand itself, which means that their share in the whole energy market grows as well. But still due to population growth and more industries especially in the emerging countries like China, India etc. we have an enormously rapid increase when we talk about energy consumption as a whole.
Sources:
1. http://www.bp.com/content/dam/bp/pdf/Statistical-Review-2012/statistical_review_of_world_energy_2012.pdf
2. http://www.eia.gov/forecasts/aeo/pdf/0383(2012).pdf
3. http://www.worldenergyoutlook.org/pressmedia/recentpresentations/PresentationWEO2012launch.pdf
